Documentation for time-domain astronomy sandbox
This package consists of a series of classes to simulate time-domain astronomy data products.
Try it on on Binder.
- Classes currently includes:
Backend: properties describing an observatory backend,Pulse: a broadband dispersed pulse,Observation: an observation data product generated for a givenBackend,RFIm: radio frequency interference mitigation functions,SNR: signal-to-noise functions,Plotting: plotting functions.
Copyright (c) Dany Vohl. 2019.
Getting the code
git clone https://github.com/macrocosme/time_domain_astronomy_sandbox.git
cd time_domain_astronomy_sandbox/
pip[3] install -r requirements.txt
Requirements
numpy>=1.17.0
matplotlib>=2.1.2
ipywidgets>=7.4.1
Getting started
Instanciate a Backend using your preferred properties and use as argument to instanciate an Observation. You can then add Pulses via add_dispersed_pulse (Pulse()) and add_rfi.
You can test it for yourself by clicking on the file "Usage example.ipynb" on Binder to launch a jupyter notebook (it takes a few second to launch the server).
Usage examples
- Load classes:
from time_domain_astronomy_sandbox.backend import Backend
from time_domain_astronomy_sandbox.observation import Observation
from time_domain_astronomy_sandbox.pulse import Pulse
from time_domain_astronomy_sandbox.plotting import plot_multi_images, plot_multi_1D
from time_domain_astronomy_sandbox.rfim import RFIm
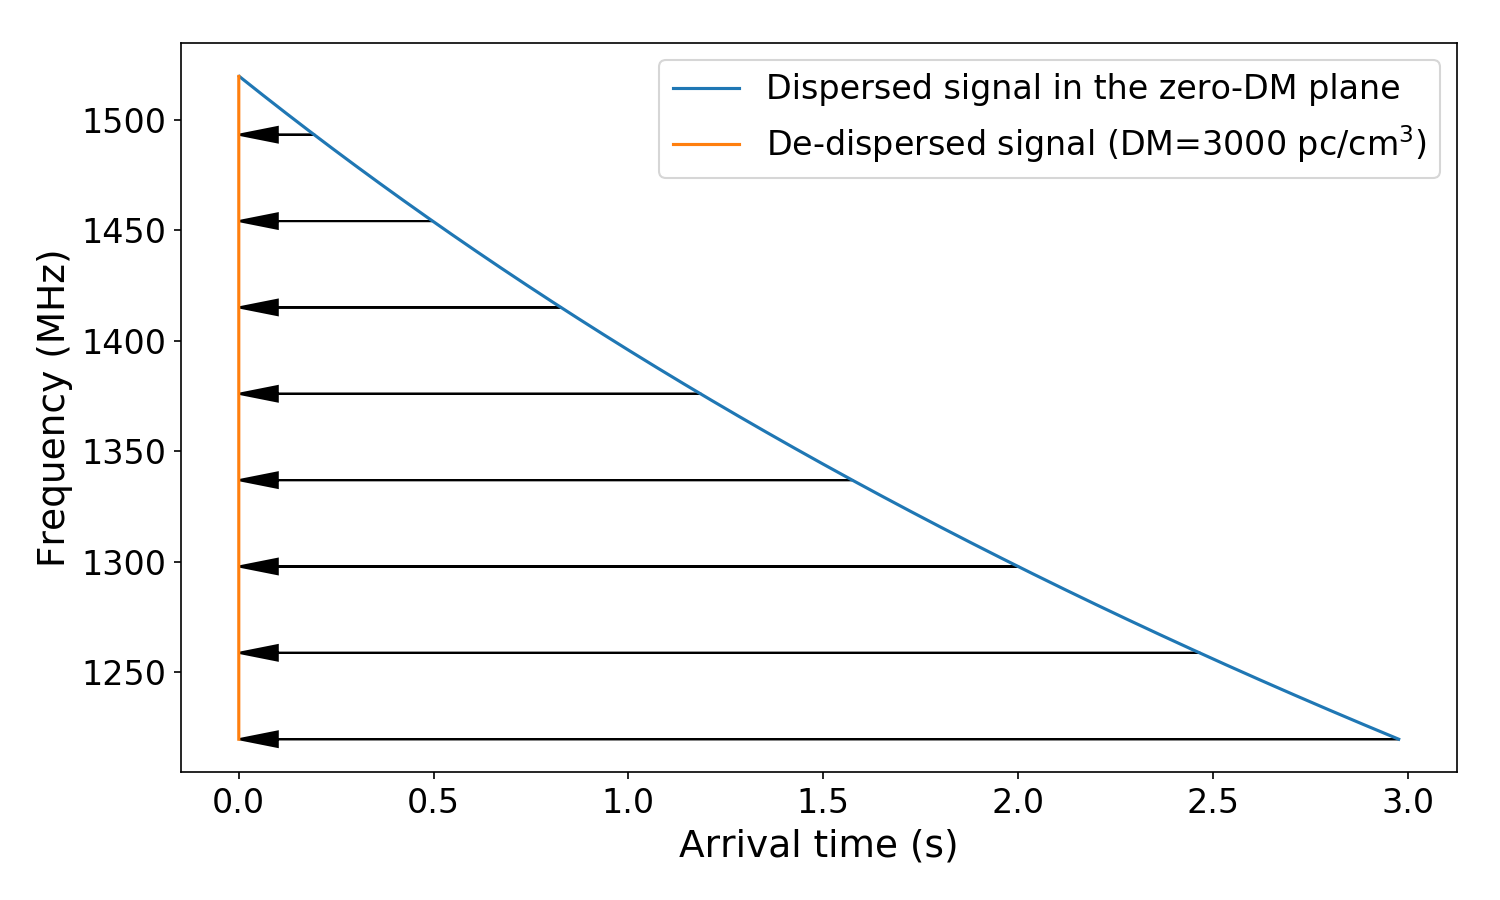
- Plot a dispersed pulse interactively (using ipywidgets)
def interactive_pulse_arts():
    """Plot interactive dispersed pulse using ASTRON's ARTS backend."""
    pulse = Pulse(Backend())
    pulse.plot_delay_v_frequency_interactive(xscale='linear')

interactive_pulse_arts()
- Plot low- and high-DM broadband dispersed pulses, narrowband periodic pulses, and run RFI cleaning.
def pulse_and_rfi__cleaned():
  obs = Observation(Backend(), length=1.024/1.5)
  raw = obs.window.copy()
  obs.add_dispersed_pulse(dm=500, width=0.006, pulse_t0=0.04, snr=15)
  frb = obs.window.copy()
  obs.add_dispersed_pulse(dm=1, width=0.006, pulse_t0=0.23, snr=125)
  obs.add_dispersed_pulse(dm=10, width=0.001, pulse_t0=0.33, snr=125)

  for t_start, t_step, t_width, f1, f2 in [
      [0., 0.01, 0.003, 350, 360],
      [0.1, 0.008, 0.005, 700, 715],
  ]:
      obs.add_rfi(
          t_start=t_start,
          t_stop=t_start+0.3,
          t_step=t_step,
          t_width=t_width,

          f_start=f1,
          f_stop=f2,

          snr=125,
      )

  xstep = 1100
  ystep = 500

  rc('font', size=16)
  rc('axes', labelsize=18)

  original = copy.deepcopy(obs)

  plot_multi_images(
      (
          raw,
          frb,
          original.window,
      ),

      labels=(
          'Noise (gaussian)',
          'Noise + Faint FRB',
          'Noise + Faint FRB + Strong RFI',
      ),

      direction='vertical',

      xticks=obs.time_indices[::xstep],
      xtick_labels=["%.2f" % t for t in obs.times[::xstep]],

      yticks=obs.backend.freq_indices[::ystep],
      ytick_labels=["%.0f" % f for f in obs.backend.frequencies[::ystep]],

      xfig_size=12,
      yfig_size=7.4,
      spectrum=False,
      colorbar=True,
      savefig=True,
      fig_name='noise_pulses_rfi',
      ext='pdf'
  )

  del raw

  o_tc = RFIm().tdsc_amber(obs.window.copy())
  o_fc = RFIm().fdsc_amber(obs.window.copy(), bin_size=Backend().n_channels, threshold=3.25)
  plot_multi_images(
      (
          o_tc,
          o_fc,
          obs.frequency_cleaning(obs.time_cleaning(), keep_state=True, bin_size=Backend().n_channels, threshold=3.25),
      ),

      labels=(
          'RFI mitigation (time)',
          'RFI mitigation (freq.)',
          'RFI mitigation (time and freq.)',
      ),

      direction='vertical',

      xticks=obs.time_indices[::xstep],
      xtick_labels=["%.2f" % t for t in obs.times[::xstep]],

      yticks=obs.backend.freq_indices[::ystep],
      ytick_labels=["%.0f" % f for f in obs.backend.frequencies[::ystep]],

      xfig_size=12,
      yfig_size=7.4,
      spectrum=False,
      colorbar=True,
      savefig=True,
      fig_name='rficlean',
      ext='pdf'
  )

  plot_multi_images(
      (
          original.dedisperse(dm=500),
          obs.dedisperse(dm=500),
      ),

      labels=(
          'Dedispersed input (DM=500 pc/cm^3)',
          'Dedispersed w/ RFI mitigation (time and freq., DM=500 pc/cm^3)',
      ),

      direction='vertical',

      xticks=obs.time_indices[::xstep],
      xtick_labels=["%.2f" % t for t in obs.times[::xstep]],

      yticks=obs.backend.freq_indices[::ystep],
      ytick_labels=["%.0f" % f for f in obs.backend.frequencies[::ystep]],

      xfig_size=12,
      yfig_size=9.4,

      loc=1,

      detection_threshold=8.,

      spectrum=True,
      colorbar=False,
      savefig=True,
      fig_name='input_dedispersed',
      ext='pdf'
  )

pulse_and_rfi__cleaned()
Contribution
If you want to contribute to the project, you can contact me or simply do a pull request on github.